Main Graphs
The main graphs are displayed at VGA
resolution (640 x 480 pixels) in 16 colours.
The graphs are more flexible than the quick
graphs as they can display any continuous
output parameter against any other.
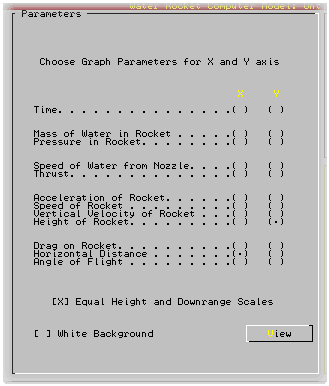
 This is the main screen that you
will see once you have selected the Main
Graphs. You can select any of the output
parameters displayed as either the x axis or
the y axis.
Although each output parameter has its
use, some combinations are quite useful under
certain circumstances: height against
velocity studied for the first second or so
is useful for obtaining the parameters for a
booster rocket to pass on as the starting
parameters for the second (sustainer) stage;
Speed of water from nozzle against speed of
rocket shows that when the rocket is going
faster towards the end of the water thrust
phase the water coming from the nozzle is
travelling upwards but still gives extra
thrust (get the students to explain that one
;-).
If you select Horizontal Distance as the x
axis and Height of Rocket as the y axis and
the horizontal distance travelled is at least
10% of the height, you will be presented a
check box that allows you to elect to have
the x and y scales equal (whether you select
metres or feet as the height units). Choosing
to have them equal (the default) gives you a
graph that looks like the one below with the
scales stretched and shrunk to fit as
appropriate.
The last option is to have a black or
white background. I have selected white for
the purposes of these help pages so that if
you want to print them out, you will not use
as much ink in the process.
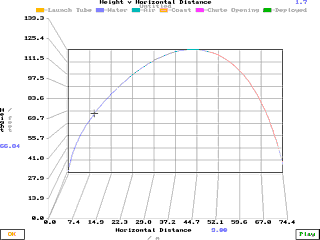
 This
is a plot of Height against Horizontal
Distance showing a timed, late chute release.
Pressing  makes the mouse cursor follow the path of the
rocket in real time - pressing again
terminates this. Getting the computer to play
the flight in real time in this way allows
you to visualise the behaviour of the rocket.
If you choose a small bore t-nozzle and
launch near vertical, a situation may occur
when the rocket almost comes to a halt in
mid-air. At this point, the rocket starts to
fall over and then, the weight of the rocket
(losing water all of the time) becomes
sufficiently low for the rocket to accelerate
again, this time at a low angle (but high
up). Using the real-time playback like this
allows the user to visualise the peculiar
behaviour of the rocket under these
circumstances.
Click on
image to view.
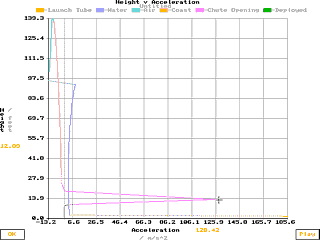
 This
is a plot of Height against Acceleration. It
shows that there is a great deal of
acceleration when the rocket is still on the
launch tube and far less when the t-nozzle is
in place but it shows that the deceleration
(in a downward direction therefore presenting
itself as an acceleration in the upward
direction) is quite significant when the
parachute opens out fully.
Click on
image to view.