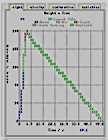
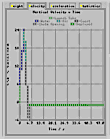
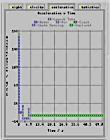
Quick Graphs Index


The Quick Graphs are meant to provide you with a quick means of finding the information that you need. The graphs that are most used are Height, Velocity and Acceleration. A cut-down version of the statistics is already provided in the top right of the program when each run is completed. On the Quick Graphs Statistics page, these are gone into in more detail.

Click on this image to go to the Quick Graphs - Height page.   Height of the rocket during the flight. Note that each stage of the flight is allocated a different colour. This is the same for each of the graphs.

Note also that when the mouse is over the graph, the numbers that appear in blue at the top left and the bottom right represent the values of the position of the mouse for each respective axis.

Each of these graphs is set against time rather than distance. For a more comprehensive set of graphs - selecting any value as the x axis and any other value for the y axis - go to the Main Graphs.

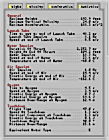
The statistics page contains as many statistics as most people will need and are generally rounded to remain meaningful although that does not preclude anyone from creating a flight that renders them meaningless.

Click on this image to go to the Quick Graphs - Velocity page.   Vertical Velocity - down is negative.
Click on this image to go to the Quick Graphs - Acceleration page.   Acceleration - again, down is negative.
Click on this image to go to the Quick Graphs - Statistics page.   Comprehensive set of statistics.


Copyright ©2000 Paul Grosse. All Rights Reserved