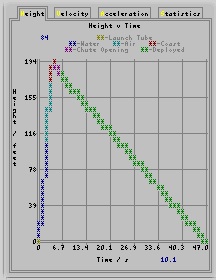
 This is a
plot of height against time. It was produced
using a 4 x 6 font, running the water rocket
simulator in a DOS box. If you are running it
in a DOS box, you can vary the size of the
font from the tool menu on the DOS box.
As the mouse moves over the plot area, the
values for its position on each axis are
printed on the graph next to each axis using
the appropriate units.
You can see on the graph, the different
stages of the rocket's flight. The yellow
portion - representing the launch rod part of
flight - is visible at the lower left part
(0,0). After that, the blue
portion represents the water thrust part -
long here because of using a t-nozzle -
followed by the air part of the thrust (cyan)
and the red
portion represents the coasting phase. Once
the rocket has reached its apogee, the
parachute starts to be deployed (magenta)
and then the parachute opens fully (green)
and it floats back to Earth.
The other quick graphs (including the
statistics) can be accessed by pressing the
initial letter for each page.