Water Rocket Computer Model Problems

Answer to problem 8

Answer - 320 x 240 pixels JPG

I asked for an explanation for the following . . .
1. to find an explanation for the maximum being
positioned so closely to the edge of the viable range.

The area of unviable launches to the left of A is where the weight of the rocket is too great for the trust given by the nozzle - showing that larger nozzles can lift more mass.

There are two things to remember with this puzzle. The first is that the launch, like all real life launches, is not completely vertical and the second is that the graph is for distance downrange - something that would be zero if it was perfectly vertical.

At position B, the mass of the rocket plus the water is the same as at A but the nozzle is larger, giving a higher initial acceleration.

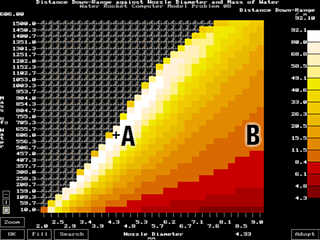
The maximum at "A" exists because the rocket starts off with a large amount of mass compared to the thrust and becasue the launch is not perfectly vertical.

If you consider the weight of the rocket as acting only downwards, ie no sideways component of force and effectively from the centre of gravity, and the thrust as providing a force that is aimed towards the centre of the rocket then, in a case where the rocket is not perfectly vertical, there is a slight sideways force, equval to the sideways force component of the thrust.

Early on in the flight, the weight of the rocket and the water in it counter almost entirely the thrust of the rocket and the rocket does not move very much. This allows the rocket to tilt over during the thrust phase, producing a good angle of elevation for flight over a long horizontal distance. The screen shot on the right shows the first second of flight and you can see how the rocket tilts over. It is produced by making the 3D graph and then selecting [A]dopt and clicking on the values suggested.

Screen dum - 320 x 240 pixels GIF

This is the whole flight, showing the effect of the slow initial burn.

Screen dum - 320 x 240 pixels GIF

This graph comes from the 3D graph again but by adopting the suggested value on the right of the graph.

The start of the flight is at the same angle but the far greater thrust does not give the tilting a chance to take any significant effect during the thrust phase. You can plot angle of flight against time and compare the two.

Screen dum - 320 x 240 pixels GIF

Return to Problem Page 8

Back to the Computer Model Page
Back to the Water Rocket Index
Site Map