Click
here to hear a sound file of a launch of this rocket [Real Media].
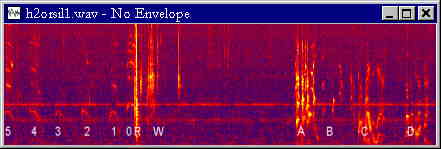
The Fourier Transform (spectrum analysis) on the left is a plot of amplitude (colour) against frequency
(vertical axis) and time (horizontal axis). As you play the sound file, you will be able to
hear the parts as you see them.
The spectrum analysis was performed using Wave Tracer Version 3.2
5 - Five
4 - Four
3 - Three
2 - Two
1 - One
0 - Blastoff
R - Release
W - Water hitting the grass
A - That's a good one.
B - Take a picture.
C - That's still way-up in the air.
D - Got caught in an up-draught.
|