Each variable that is chosen has to have a
range - an upper and lower limit - so that
the effect of that variable can be  explored
in the graphical output.
When an x or y variable is chosen, an
upper and lower limit are chosen with the
current value at the centre of that range. If
a limit is out of a suitable range - such as
an angle greater than 90º or less than 5º -
then that range is clipped to the limit. If
you are not happy with the limits chosen by
the model, you can type in your own values.
Note that if you put a value in the lower
limit cell that is higher than that in the
upper limit cell, this will be
accepted as sometimes people want to have
graphs this way around for some display
purposes.
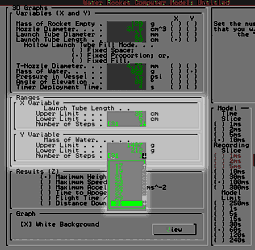
You can select the number of points on
each axis choosing between 1, 7, 9, 11, 13,
15, 17, 19, 21, 23, 25, 27, 29 or 31 points -
the number of points selected on one axis
need not be the same as the number of points
selected on the other axis. This is done
using the drop-down combo as shown in the
screen shot on the right.
The option of 1 point is included if you
want to optimise for one variable only - it
not mattering which variable is selected for
the axis with only one point. In the case of
1 point, the axis with one point will have
its value as the average of the upper and
lower limits excepting the above case where
one of the limits is beyond a natural limits
such as an angle greater than 90º. In this
case, make the upper and lower limits the
same.
Another point to note is that by selecting
a greater number of points, you are making it
longer to calculate the entire graphical area
(selecting 31 instead of 21 points along both
axes will require 961 instead of 441 points -
and increase of 118% on the calculation time)
although you will get more precise results
using a search and only have to perform half
as many calculations again (this is because
the search function is linear - see more
about the search in Optimisations).
Copyright
©2000 Paul Grosse. All Rights Reserved