PC Plus HelpDesk - issue 242
This month, Paul Grosse gives you more insight into
some of the topics dealt with in HelpDesk
|
 |
HelpDesk
Named Pipes
You can create a pipe by using mkpipe. Supposing you want to make a pipe called 'cu' in '/home/paul/bin/perl'. You would do it like so... mkpipe /home/paul/bin/perl/cu You can set the permissions in the usual way - you can see that I have made mine rw-rw----. |
 Once the pipe is created, you can use it just
like any file except that it needs to have a program
listening to it in order to be able to write to it Once the pipe is created, you can use it just
like any file except that it needs to have a program
listening to it in order to be able to write to itThe tiny Perl program on the right will take whatever you type in, open the pipe using '+<' as the opening mode and print it to the pipe. |
 If you happen to be running the program on
the right in another shell, then it takes what has just
been written to the pipe and prints it to STDOUT (the
screen usually). If you happen to be running the program on
the right in another shell, then it takes what has just
been written to the pipe and prints it to STDOUT (the
screen usually).By using '+<', you can have this program monitoring the pipe continuously (as a daemon) and have many other programs write to it. If you were to use '>>' (append and write) as the opening mode on the writing program, then the writing program would not exit until either it was sent a signal (such as [Ctrl][C] from the shell) in which case the contents of the pipe would be lost; or, until a reading program came along and read the contents of the pipe. With '>>' in the write program, pressing [Ctrl][D] breaks out of the 'while' loop but the program doesn't exit until the pipe is read. With '+<' in the write program, pressing [Ctrl][D] also breaks out of the 'while' loop but the program exits without the pipe being read - even if you invoke the reader program afterwards. So, if you want a program to run all of the time, monitoring the use of the pipe, you shouldn't have any problems. If you want to be able to send data to a pipe but then not lock up until the pipe is read, use '+<'. You can, of course, use an alarm to break out of a locked up pipe so that you don't end up with loads of zombie-like programs sitting around, waiting for something to come along and listen to them. |
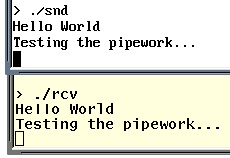 This is an example of the two programs
included in
this directory here as a tar.gz file working
together. 'snd' sends messages to the pipe ('cu') and
'rcv' receives them and displays them. This is an example of the two programs
included in
this directory here as a tar.gz file working
together. 'snd' sends messages to the pipe ('cu') and
'rcv' receives them and displays them.The programs supplied are compressed in a tar.gz file. The reason I haven't created a zip file for Windows users is two-fold:
|
Port Scans
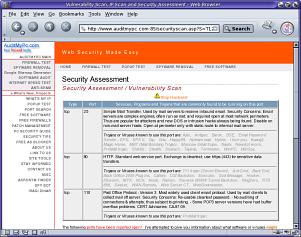
There are a number of sites that will scan your firewall for vulnerabilities for free - sending you a web page with the results on it when it has finished. This one is AuditMyPC.com (http://www.auditmypc.com/) and, as you can see, it has discovered that there are three ports open on this firewall (a hardware firewall/router) on ports 25 (SMTP) 80 (HTTP) and 110 (POP3) - in this case, they are supposed to be open. Click on the image on the right to see the screenshot full sized. The browser was Mozilla running on Solaris 10 going through two firewalls. |
Test Your Own Broadband Connection SpeedYou can test the responsiveness of your ISP's web server just by pinging it. However, if you are paying for a particular bandwidth, how do you know if you are getting it? Some of the download programs such as those run under various web browsers will tell you how fast a file is currently downloading but the big drawback of that is that you have to be at a browser, downloading a file in order to see how fast the connection is. If you want to know how fast your connection is at all times of the day, you need to be able to do a number of things:
So, first of all, upload a large(ish) file - maybe around 500kB - to your ISP's web server. This will give your monitoring program enough of a chance to get a stable reading during the process. The first law of analysis is that an inadequate sample cannot give meaningful results. Next, you need to install Perl and the GD library. On Linux/BSD/UNIX systems, this should be part of the distribution (certainly Perl itself is) but if you cannot find the GD library, you can install it from CPAN. If you find that you cannot get GD for your system you can always tweak the program so that it outputs a graph in the form of an HTML page. Also, you need to install WGET - again, this should be part of your distribution or you can download it from the Internet. All of these work on Linux and should work on Windows. After that, click here to open the directory with the files in it in another browser window. Create a directory in your home directory and copy the files from the /home directory in the browser window into your new directory. Create a directory in your server directory (possibly
called 'bbspeed' or similar) and copy the files from the
/server directory into that. In your server config file
(httpd.conf or similar) you might want to make that
directory password protected or even put it in another
directory (one that is not within the confines of the
server root) if you aren't going to need to look at it
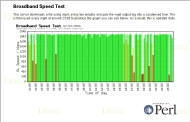
from anywhere other than the local machine. Next, open the Perl script files and edit any paths that need it, to the ones that you have on your machine (really, just where you have put these files) and then there is only one thing left to do. Finally, open up the crontab file in /etc and copy the lines from the /crontabfrag/crontab.frag file into it - changing any paths as required. If you have done everything correctly, you should get a picture like the one on the right (click on it to open it in a new browser window/tab). |
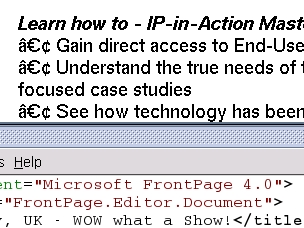
Bad characters in HTML in MS FrontPage
On the right, you can see how some characters have been used that do not appear in the browser's character set for the default font that is being used - why should someone who is building a web page assume that everybody who is important enough will have the same set of fonts that the designer does? The font used in the screenshot is Adobe Helvetica so it is not as though this is with some shoddy, couldn't-be-bothered font that is missing all of the 'important' characters including the tags. The real problem with this web page is that it is encoded in 'Unicode utf8' although there is no mention of this anywhere in the document. The section of text at the top is a bulleted list but instead of using the normal <ul><li>Gain direct...</li>...<ul> type tags which provides a nice looking, neat list, they have used line-breaks and special characters. Clearly, using a centred bullet point that requires the user to use an encoding that is not mentioned anywhere in the document and also failing to use the standard method of creating bulleted lists is very poor. And the culprit? 'Microsoft FrontPage 4.0' apparently. |
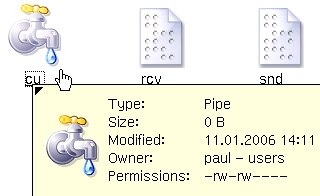 On
UNIX-like systems there are a number of different types
of 'file' that can exist. One of these is the 'named
pipe' or FIFO (First In: First Out). As you can see from
the screenshot on the right, they are zero-length and
have permissions just like any file or directory.
 We often
see puzzles with estimates of the amount of time that it
would take for a person to complete it, but how can this
be worked out automatically?
 We'll use
OpenOffice.org's spreadsheet 'Calc' because it: is good
quality; has good functionality; does everything that
99.9 percent of the spreadsheet user population needs a
spreadsheet to do; is cross-platform; and, is free.
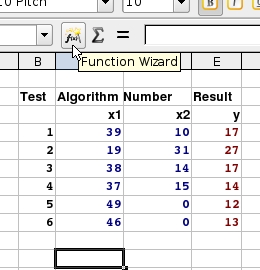
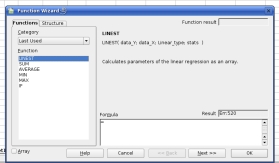 Next, the
Function Wizard opens and you are presented with a list
on the left of functions and categories. You need to
choose 'LINEST'. If you select the 'All' category, you
will find it but otherwise, it lurks under the 'Array'
category (its output is in the form of an array) or, if
you have used it recently, if you click on the category
dropdown list and move to the top, you will see the 'Last
Used' category which can be very helpful.
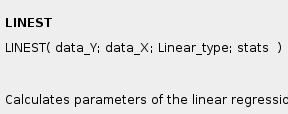 This is
the format of the LINEST function. Instead of typing in
the data directly into the cell, I would recommend using
the wizard. Next, click on 'Next >>'.
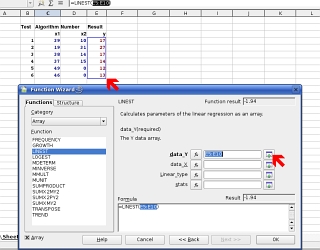 This is
the dialogue box that appears next. In the top field, you
need to input the dependent variables (the time results
from your experiments in this case as they are dependent
on the puzzle produced and solved by your program.
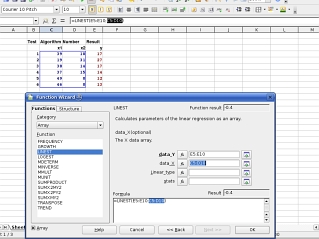 Next,
repeat this with the independent variables (your
algorithm counts).
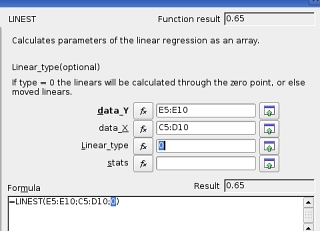 Next, you
have to decided whether it wants to calculate your
factors so that the best fit goes through the origin or
not. If you want it to go through the origin, type zero
(0) here, or else, a 1.
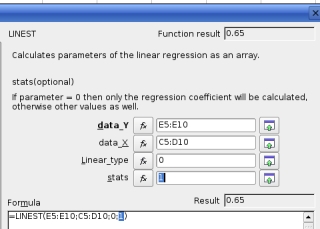 If you
need the accompanying statistics - letting you how good a
fit the regression was and so on - then use a 1, else use
a 0 if you only want the factors.
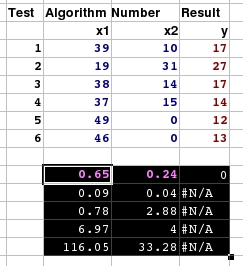 Now, you
have your results. In this case, we have two input
variables. In the results block, the row of numbers at
the top (in the case where you have the statistics output
as in this case) are the factors. The number at the right
is the constant if you decided that the regression should
not pass through the origin - otherwise it is zero which
effectively means the same thing. The value to its left
is the first factor (in this case for column X1) and the
value on the left is for the seconds column (X2).

 The World-Wide Web
has minimum standards that everybody really should adhere
to if they want their websites to work properly with the
audience that they are aiming at. I'm not talking about
using the right tags here, I'm talking about using
characters that are likely to be found in the fonts used
by people's browsers.